The objective of this post is to showcase the right method to collect Console, Debug and Defender logs for troubleshooting Prisma cloud and compute issues. If you know the right process to collect logs, it can really help you to expedite the support case and the resolution with the vendor. I have also provided the screenshots to help you, in case you are new to Paloalto products.
Below mentioned are the logs, you can collect for Prisma compute and enterprise edition.
- Debug logs for Compute edition (Self Hosted)
- Defender logs for Compute edition (Self Hosted)
- CONSOLE LOG FOR ENTERPRISE EDITION (COMPUTE SAAS)
- DEFENDER LOG FOR ENTERPRISE EDITION (COMPUTE SAAS)
Procedure – Data Collection while opening a Palo Alto Networks TAC Support Case for Prisma Cloud and Compute
Console and Defender logs help us identify the root cause of a problem, and provide a timely resolution. If you contact Paloalto Support with a Prisma Compute issue, you’ll be asked to collect Console and defender logs, from your Prisma compute Console and send it to Paloalto for further investigation.
DEBUG LOGS FOR COMPUTE EDITION (SELF-HOSTED)
Follow these steps to collect Debug logs for Prisma compute edition.
Step1 – Login to your Compute Console
Step2 – Go to Manage > View Logs > Console
Step3 – Either automatically upload the logs to Paloalto with the “Upload Debug Logs To “Prisma Cloud Support” button
You can follow this procedure to automatically upload the debug logs to the Prisma cloud support else you can download and upload the logs manually to the case as shown in the next step.
Step4 (optional) – Download the logs with the “Download Debug Logs” button and manually upload them to the case

DEFENDER LOG FOR COMPUTE EDITION (SELF-HOSTED)
Below mentioned steps will help you to collect defender logs for compute edition of Prisma.
Step1 – Login to your Compute Console
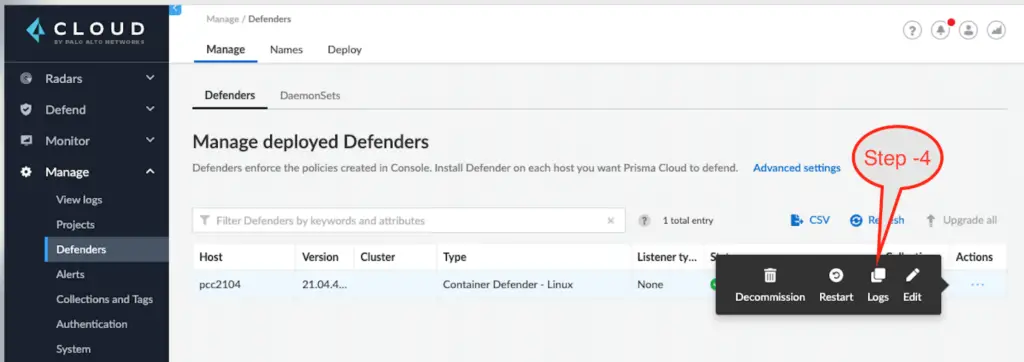
Step2 – Go to Manage > Defenders > Manage
Step3 – Choose Defenders from the tab and find the appropriate Defender in the list
Step4 – Then open the Actions menu in the rightmost column

Step5 – Click the “Logs” button
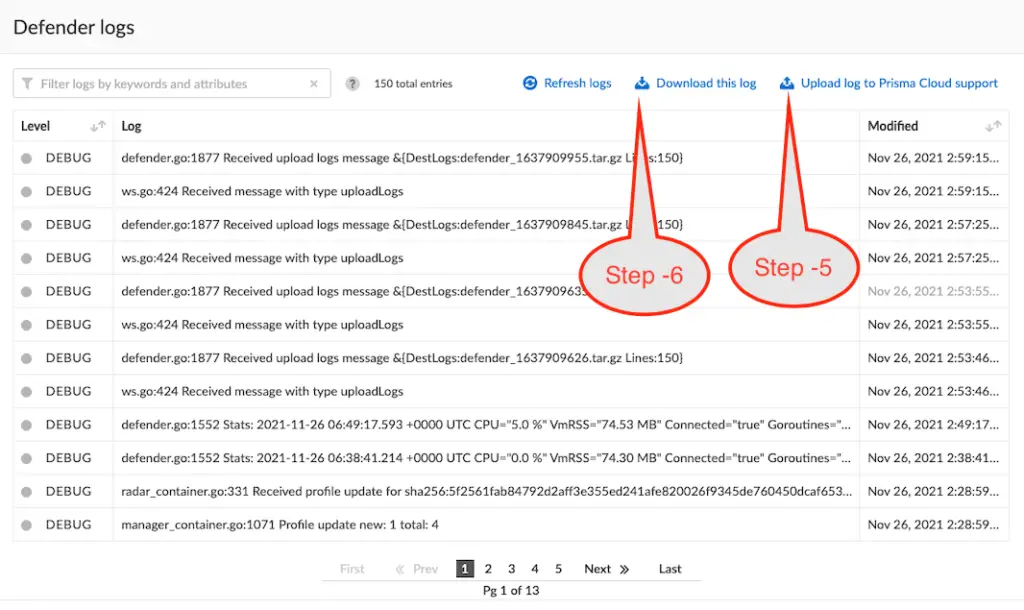
Step6 – You can automatically upload the log to us with the “Upload Log To Prisma Cloud Support” button
OR
Step7 – Download the log with the “Download This Log” button and manually upload it to the case
CONSOLE LOGS FOR ENTERPRISE EDITION (COMPUTE SaaS)
Step1 – Login to your Compute Console
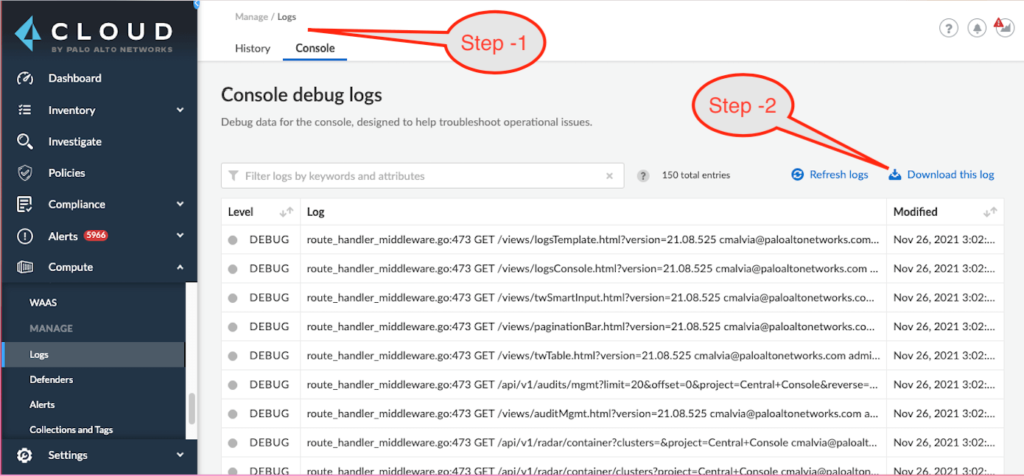
Step2 – Go to Manage > View Logs > Console
Step3 – Download the logs with the “Download Debug Logs” button and manually upload them to the case
DEFENDER LOG FOR ENTERPRISE EDITION (COMPUTE SaaS)
Step1 – Login to your Compute Console
Step2 – Go to Manage > Defenders > Manage
Step3 – Defenders and find the appropriate Defender in the list
Step4 – Then open the Actions menu in the rightmost column
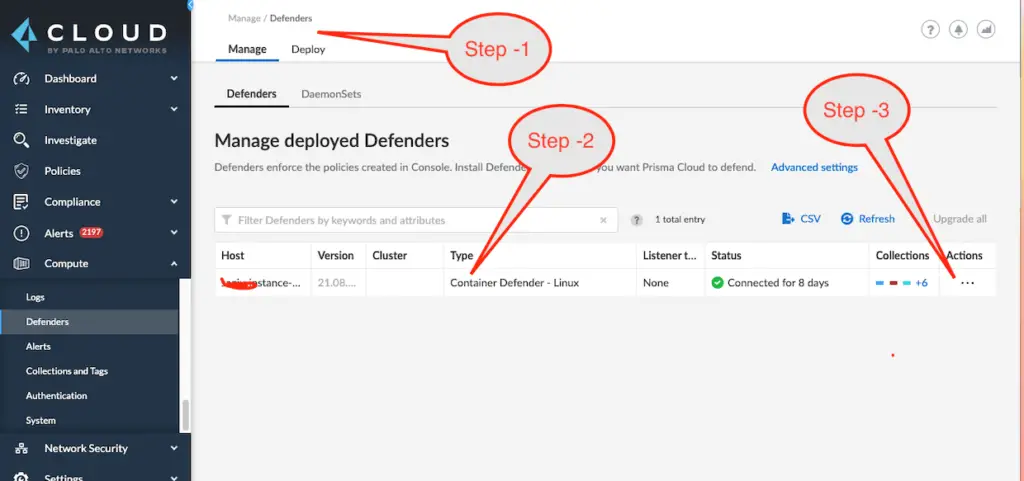
Step5 – Click the “Logs” button

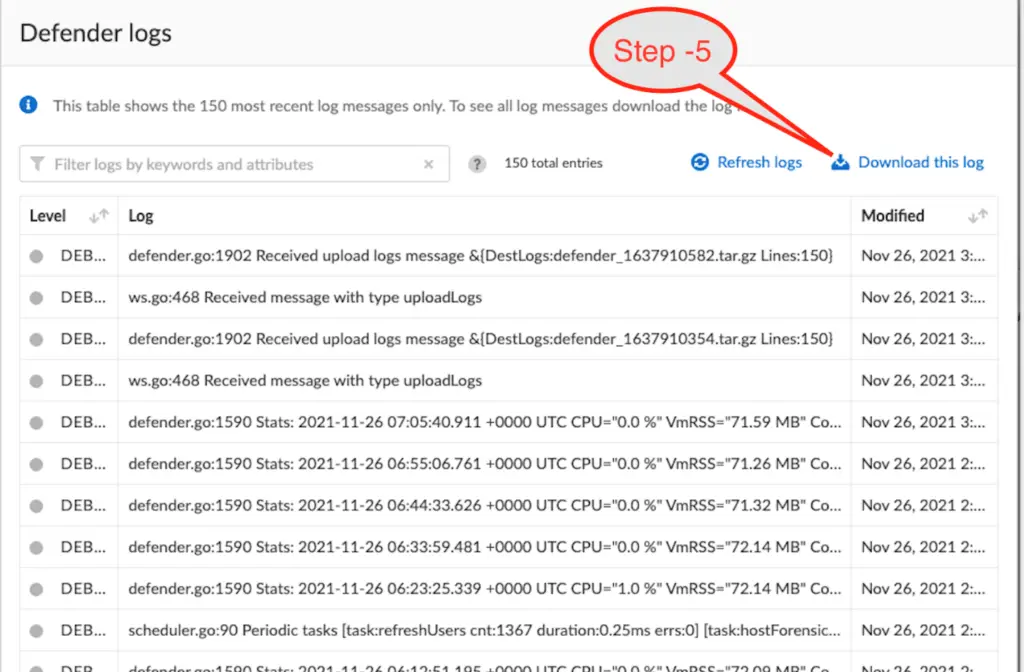
Step6 – Download the log with the “Download This Log” button and manually upload it to the case
Summary
I hope you find this article useful and know the recommended way to collect debug, console and defender logs for Prisma SaaS and self-hosted compute products. Generating these logs quickly and uploading them to Paloalto will definitely help you to get the solution faster. You can also check out Paloalto links for further information if required.

